As mentioned in the previous post, goals scored are not entirely comparable. While today’s players get more games, the games played in the early years of the World Cup had more goals. So, in a way it was easier for Just Fontaine to rack up 13 goals in just 6 games, when in 1958 there was an average of 3.6 goals/game. Here is a quick visualization of the World Cup Goal Average (WGA) over the years:
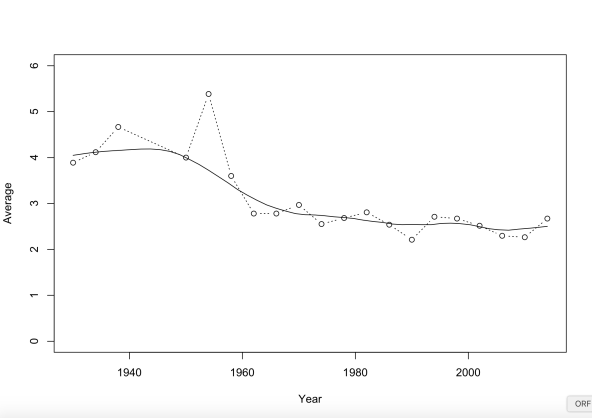
As we can see from that graph, there were a lot of goals before 1960 and since there is a small but steady decline. Maybe things are pointing up again after Brazil 2014, but I doubt it. The solid line is a LOESS trend-line which should take out all random variation. As we can see, the huge outlier 1954 is taken as such, while most values are scattered closely around the line. Of note is also that this way, the 1990 World Cup is really seen as an abnormality. Whether this is actually the case is a good point for discussion: prior to 1992 a goalie could handle a back pass from his own players, which allowed a defense to manage a lead much better. But also, the weather in 1994 was a lot more demanding which often leads to more goals. So, let’s see which is better, the raw data or the smoothed line.
So, how do we adjust now? Well, first of all we need a reference point to compare the value of a goal of say 1950 to say 2010. To me it makes most sense to put everything in reference to the current (i.e. most recent) standing and that would be the 2014 World Cup. Let’s stick with raw data at first and we have a reference WGA of 2,67 goals/game. Now goals scored in tournaments with a higher WGA should count less, while goals scored in tournaments with lower WGA should count more. To achieve this, we divide the reference WGA, WGAref, by the individual tournament WGAs, WGAt, and compute the tournament goal values as
GVt = WGAref/WGAt.
Here is the full list of these goal values (based on raw data as well as LOESS smoothing) with reference 2014 (i.e. a goal at the 2014 World Cup has value 1.00):
| Year | Raw Avg | Raw GV | LOESS | LOESS GV |
| 1930 | 3.889 | 0.687 | 4.049 | 0.618 |
| 1934 | 4.118 | 0.649 | 4.118 | 0.608 |
| 1938 | 4.667 | 0.573 | 4.156 | 0.602 |
| 1950 | 4.000 | 0.668 | 3.999 | 0.626 |
| 1954 | 5.385 | 0.496 | 3.724 | 0.672 |
| 1958 | 3.600 | 0.742 | 3.400 | 0.736 |
| 1962 | 2.781 | 0.961 | 3.107 | 0.806 |
| 1966 | 2.781 | 0.961 | 2.895 | 0.865 |
| 1970 | 2.969 | 0.900 | 2.768 | 0.904 |
| 1974 | 2.553 | 1.047 | 2.741 | 0.913 |
| 1978 | 2.684 | 0.995 | 2.695 | 0.929 |
| 1982 | 2.808 | 0.952 | 2.626 | 0.953 |
| 1986 | 2.538 | 1.053 | 2.565 | 0.976 |
| 1990 | 2.212 | 1.208 | 2.545 | 0.984 |
| 1994 | 2.712 | 0.985 | 2.547 | 0.983 |
| 1998 | 2.672 | 1.000 | 2.566 | 0.976 |
| 2002 | 2.516 | 1.062 | 2.494 | 1.004 |
| 2006 | 2.297 | 1.163 | 2.421 | 1.034 |
| 2010 | 2.266 | 1.179 | 2.454 | 1.020 |
| 2014 | 2.672 | 1.000 | 2.503 | 1.000 |
Now, how do we use these GVs? Well, let’s look at Miroslav Klose as an example. In 2002 and 2006 he scored 5 goals each, in 2010 it was 4 goals and an in 2014 2 more goals. So, his time adjusted goal tally using raw data is
Gadj= 5*1.062 + 5*1.163 + 4*1.179 + 2*1.000 = 17.844.
So, his 16 goals in 4 tournaments from 2002 to 2014 are the equivalent of 17.844 goals in 2014. Given that Klose scored most of his goals in tournaments with low WGA, it was obvious that his score would get slightly inflated. We can of course do the same for the smoothed WGAs and arrive at an time adjusted smoothed goal tally of 16.268 for Klose. With this method it is of course hard to see how Klose could be unseeded from his top spot in the overall scorer standings:
| Name | Goals | Gadj | Gadj,LOESS | Rank LOESS | ||
|---|---|---|---|---|---|---|
| 1 | Miroslav Klose | 16 | 17.844 | 16.268 | 1 | |
| 2 | Ronaldo | 15 | 15.987 | 15.033 | 2 | |
| 3 | Gerd Müller | 14 | 13.187 | 12.698 | 3 | |
| 4 | Jürgen Klinsmann | 11 | 11.551 | 10.791 | 4 | |
| 5 | Gary Lineker | 10 | 11.148 | 9.790 | 7 | |
| 6 | Thomas Müller | 10 | 10.897 | 10.100 | 5 | |
| 7 | David Villa | 9 | 10.386 | 9.202 | 11 | |
| 8 | Grzegorz Lato | 10 | 10.269 | 9.205 | 10 | |
| 9 | Gabriel Batistuta | 10 | 10.004 | 9.812 | 6 | |
| 10 | Pelé | 12 | 9.974 | 9.706 | 8 | |
| 11 | Just Fontaine | 13 | 9.648 | 9.571 | 9 |
OK, that surely did not improve things compared to the unadjusted table. Adjusting for goal value demotes the players from yesteryear and promotes players that played more recently – especially in 1990. Fontaine’s incredible 13 goal tally is now worth a lot less, while Lineker and Klinsmann get quite the boost. If we use the smoothed version, the Top 4 remain the same, but Pelé and Fontaine do not drop as much. Kudos to Gerd Müller who as a more senior player steadfastly remains in the Top 3.
So, how about adjusting for games played in addition which gives us the players adjusted goal average, GAadj.
| Name | GA | GAadj | GAadj,LOESS | Rank LOESS | ||
|---|---|---|---|---|---|---|
| 1 | Oleg Salenko | 2.000 | 1.971 | 1.965 | 1 | |
| 2 | Just Fontaine | 2.167 | 1.608 | 1.595 | 2 | |
| 3 | Eusébio | 1.500 | 1.441 | 1.297 | 5 | |
| 4 | Guillermo Stábile | 2.000 | 1.374 | 1.236 | 6 | |
| 5 | Tomáš Skuhravý | 1.000 | 1.208 | 0.984 | 9 | |
| 6 | James Rodriguez | 1.200 | 1.200 | 1.200 | 7 | |
| 7 | Sándor Kocsis | 2.200 | 1.092 | 1.479 | 3 | |
| 8 | Salvatore Schillaci | 0.857 | 1.036 | 0.843 | 12 | |
| 9 | Christian Vieri | 1.000 | 1.028 | 0.988 | 8 | |
| 10 | Gerd Müller | 1.077 | 1.014 | 0.977 | 10 | |
| 11 | Josef Hügi | 2.000 | 0.992 | 1.344 | 4 | |
| 12 | Leônidas | 1.600 | 0.931 | 0.965 | 5 |
Hmmmmmmmm … There are elements of this list that I like (Fontaine, Eusebio and Stábile high up, good mixture between older and newer players) , but two things totally discredit it to me: the Bomber is only in 10th place for both rankings. If it comes to pure goal scoring ability, I think one would be hard pressed to find any better player. So, a #10 ranking just does not look right. And then of course the player on top! Thinking about it, it was obvious that Oleg Salenko would rank very high: a high GA in only a single World Cup, which also has a relatively high GV. And while I could see an argument for Salenko having the best single game goal scoring achievement in his 5 goal game against Cameroon (if we forget the shambolic defense and poor motivation of the Africans), I truly have a hard time crowning Salenko as the best World Cup goal scorer of all time. In addition to running up the score on an inferior opponent, these goals also came in a game with nothing to play for.
There are also smaller things, that I do not like. In particular, Skuhravý is ranked higher than Schillaci. Both played in the same tournament (Italia 1990), but Skuhravý’s goals came in tow games: 2 in a 5-1 rout of the USA and 3 in a 4-1 rout of Costa Rica in the second round. Compare that to Schillaci, who scored in 6 different games and 4 of these were game winners and 1 the go-ahead goal in the semi-final! In every regard, Schillaci’s performance was more impressive.
Now, comparing the GAs based on raw data and LOESS smoothing, I do like the raw data better as is mixes the different World Cup periods slightly better. But again, I think that overall both adjusted lists do not satisfy me.
Also, the problem with some players racking up goals against weak opponents, while others consistently score important goals is also present in the previous ranking of adjusted total goals. And while it is easy to knock on Salenko, the same argument can be applied to certified super striker: Gabriel Batistuta. 10 goals surely look impressive, but 3 of these came against a weak Greece team in 1994 and 3 more were add-on goals against a similarly out of sorts Jamaica. That leaves 4 more goals, two of which were penalties in the second round. Batigol was one of my favorite players of the late 90s, but this is not very impressive. Compare this to Eusébio’s 9 goals, where Portugal had to play in the group of death with Brazil, Hungary and Bulgaria, Eusébio had to bring back his team from 0-3 deficit against the pesky North Koreans and then lead Portugal to a third place finish with 2 more goals …
So, while I still think that adjusting for tournament GV is a good and necessary step, there is still some way to go to find a satisfying list taking care of the problems inherent in both of the above. So, to improve the listing, I come to three conclusions:
- We have to consider not only the fact that a goal was scored, but also how important that goal was. Scoring the third to fifth goals in a 5-0 rout is a nice feat, but all these goals were not important in securing the win. Conversely, scoring three game winning goals in three consecutive games is a highly impressive streak. Also, scoring the game winner in the World Cup final is more important/valuable than doing so in the group stage.
- Relative performance is a nice measure, but I do start to prefer the absolute performance. While on a very small scale, the Skuhravý vs. Schillaci comparison highlights the shortcomings of relative performance. If we also take importance into account, I think a player scoring many important goals over a larger number of games should be considered a greater goal scorer than one scoring two game winners in two games.
- The smoothed curve was a nice idea, but the raw data so far led to more satisfying results. I will keep comparing the two adjustments methods, but as of now advantage raw data
Well, the journey has just begun and I hope to get you deeper into World Cup goal scoring history and some statistics in the next post.

You must be logged in to post a comment.